Volume Profile and Volume Indicator by DGTVolume Profile (also known as Price by Volume) is an charting study that displays trading activity over a specified time period at specific price levels. It is plotted as a horizontal histogram on the finacial isntrumnet's chart that highlights the trader's interest at specific price levels.
The histogram is used by traders to predict areas of support and resistance. Price levels where the traded volume is high could be assumed as support and resistance levels.
Price may experience difficulty moving above or below areas with large bars. Usually there is a great deal of activity on both the buy and sell side and the market stays at that price level for a great deal of time
It is advised to use volume profile in conjunction with other forms of technical analysis to maximize the odds of success
Light version of Volume Profile is added to Price Action - Support & Resistance by DGT
스크립트에서 "volume profile"에 대해 찾기

Volume Profile HeatmapA variation of a Volume Profile based on code originally by LuxAlgo. () The traditional bar chart is replaced with full-width bars that are brighter for high volume price levels.
Like a traditional VP, its purpose is to visualize how volume corresponds to specific price levels, allowing you to get a quick idea of where the most activity is occurring, and where it hasn't been. This information may provide clues as to where price action may return, areas of support and resistance , and regions where price may move quickly. The basic concepts behind any Volume Profile (or Price by Volume Chart) should apply here as well. (investopedia article)
Inputs are set up such that you can customize the lookback period, number of rows, and width of rows for most major timeframes individually. Timeframes between those available will use the next lower timeframe settings (e.g., 2m chart will use the 1m settings.)
This indicator is experimental and is likely to receive further updates.

Volume Profile cheap copyIn the absence of TradingView's open-source Volume Profile (hereinafter referred to as VP) indicator code, I have replicated it. However, because this code is classified as an "indicator" rather than a "tool," it cannot allow users to define the range according to their preferences. In the code, I have set different periods, and users can input 0, 1, or 2 to let the indicator calculate the volume distribution from the earliest candle to the latest candle within the daily, weekly, or monthly range, respectively.
How can we prove that this code is consistent with TradingView's algorithm?
Firstly, the calculation or drawing process of VP starts from the earliest candle in the selected range. After calling TradingView's built-in "Fixed Range Volume Profile" (FRVP) tool, you can enter the settings interface of the tool and check both "developing POC" and "Value Area (VA)." The paths of POC, VAH, and VAL will appear in the chart. These paths are the changes in the values of POC, VAH, and VAL as the number of candles increases. If the paths shown by my indicator are the same as those shown by TradingView's VP indicator, then it proves the algorithms are consistent. Since VP itself is calculated based on volume, the high and low points of candles, and the opening and closing prices, if the data sources are consistent, the calculation results (the paths of POC, VAH, and VAL) will remain consistent over time. This can be used to infer that the algorithms are consistent. Additionally, the parameters of the two indicators (number of rows and value area ratio) must be the same to verify consistency. The number of rows in the indicator is usually set to 100 by default, and the value area ratio is 70. Therefore, the parameters in FRVP should also be set to 100 rows and a value area volume of 70.
Why is there a noticeable discrepancy?
When the start and end points of the VP remain unchanged, reducing the chart's time frame can improve accuracy. For example, when calculating the weekly VP, switching from a 1-hour time frame to a 5-minute time frame can make the indicator more closely match TradingView's native VP. Tests have shown that TradingView's native VP may not use the data displayed on the current chart for its calculations. For instance, the VP may use data from the 5-minute time frame even if the chart is displayed in the 1-hour time frame. However, my replicated VP calculates based on the chart's data, so differences in time frames will affect accuracy.
Current algorithm deficiencies
This replicated VP code is merely a demo and does not handle data updates. In other words, after the latest candle closes, the VP needs to be recalculated, but this recalculation step is not handled, which will cause errors. To resolve this issue, you only need to switch the time frame or delete the indicator and re-add it.

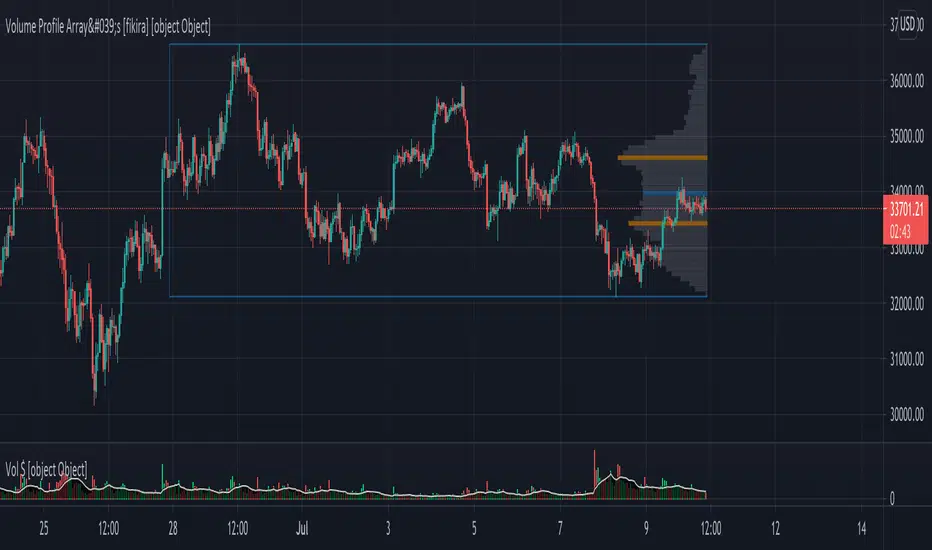
Volume Profile Array's [fikira]Inspired by © IldarAkhmetgaleev (AkhIL) - "Poor man's volume profile" - "PMVolProf"
He did a fantastic job on "Volume Profile"!
My script is about making this with array's
Settings:
- period (last x bars) for calculation
- max width (visible horizontal range)
- amount of sections (vertical sections; to many sections can give an error -> lower the sections in that case)
Setting "high/low", "close":
- "high/low"
-> the volume of every bar (in the period) which low is lower than a particular section and which high is higher than that section is added to that section
- "close"
-> here the volume of every bar (in the period) which close closes in the range of a particular section is added to that section
The orange/blue coloured "Volume lines" are the highest/lowest values above and below present close
(can be used as Support/resistance )
"Only show max/min" shows only the orange/blue Volume lines
The period and highest/lowest is show by 2 thin blue lines
Color, line width is adjustable
Cheers!
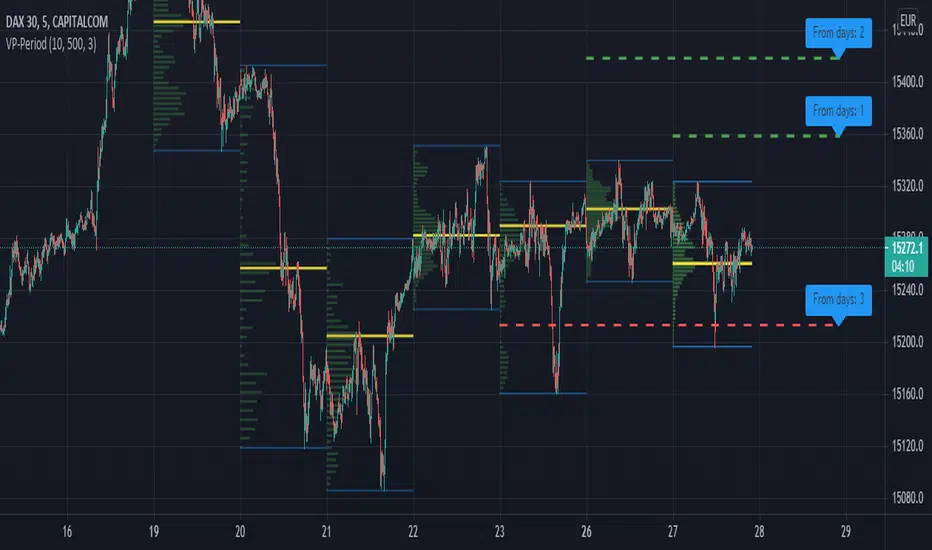
Volume Profile per day with support/resistance linesThis indicator shows the volume profile by daily blocks and draws on the chart the support or resistance lines produced by the previous volume profile block. A support line will be created if in the previous block, the VPOC line was closer to the lowest price line of that block. This support line will be placed below the VPOC line, at a distance equal to the difference between the highest price of that block and the VPOC price. For the case of the resistance line, the logic applied is analogous.
These support and resistance lines are introduced because, according to the Gaussian bell, the VPOC is likely to be located in the middle, and these deviations can be used to trace support and resistance.
In addition, the indicator includes the following features:
- Change the colors of all plotted lines.
- Define the number of daily blocks to be displayed.
- Define the resolution when calculating the volume of each candle.
- Define the number of support/resistance lines to be displayed.
- Highest and lowest price lines, as well as vpoc line, volume histogram and support and resistance lines.
- Display or not, the vpoc line and the volume histogram.
The calculations performed by the script improve if the candles used are of a lower timeframe. This indicator has been tested in several markets, including cryptos, CFDs, Forex and Indices.
Volume Profile / Fixed RangeHello All,
This script calculates and shows Volume Profile for the fixed range . Recently we have box.new() feature in Pine Language and it's used in this script as an example. Thanks to Pine Team and Tradingview!..
Sell/Buy volumes are calculated approximately!.
Options:
"Number of Bars" : Number of the bars that volume profile will be calculated/shown
"Row Size" : Number of the Rows
"Value Area Volume % " : the percent for Value Area
and there are other options for coloring and POC line style
Enjoy!

Volume ProfileThis is a Volume Profile based on pine script arrays.
The main idea behind this script is from the user @IldarAkhmetgaleev .
He created an awesome piece of code for free users on tradingview.
Here are some changes to the main script:
0. Used Pine Script Arrays for doing/storing calculations.
1. The bar labels are replaced with lines.
2. Added a POC line.
3. Bar growing directions changed from right to left.
4. Added an option to change bar width.
Inputs:
0. Volume Lookback Depth : Number of bars to look back for volume calculations.
1. Bar Length Multiplier : Bar length multiplier to make bar long or short.
2. Bar Horizontal Offset : Horizontal distance from the current bar in the right direction.
3. Bar Width : Width of the bars.
4. Show POC Line : Show or hide the POC line.
Happy trading.
Volume Profile Fixed Range Support and Resistance LevelsThis script is based on the excellent Volume Profile / Fixed Range indicator by @LonesomeTheBlue, so all credit for the foundations of this indicator goes to @LonesomeTheBlue
I basically made 5 instances of the original script and added horizontal lines at the beginning and end of the each Value Area. To use the script as a support and resistance tool without the Value Areas and Point of Control (POC) labels you just need to untick "Boxes" and "Labels" in the "Style" section of the “Settings”.
The default look-back periods (in bars) are 7, 30, 60, 180 and 365, but you can change this or the colour of the lines easily in the “Settings”.
The dashed lines are the respective POC.
I find this tool to be very useful for quickly identifying interest levels on any chart while also ensuring a certain amount of objectivity in your TA.
Hope you find it useful and thanks again to @LonesomeTheBlue for going through the trouble of coding this and being so generous to share it with the rest of us!
Good luck out there!

Dynamic Rolling Volume Profile [DK]This indicator transforms the traditional static Volume Profile into dynamic, flowing lines that react to price action in real-time. Designed for Futures day traders and algorithmic analysis, it visualizes the Point of Control (POC) and Value Area (VAH/VAL) as continuous moving averages rather than fixed histograms.
Unlike a Fixed Range Volume Profile, this script utilizes a Rolling Window algorithm. For each bar, it recalculates the volume distribution based on a user-defined lookback period (e.g., the last 100 bars), identifying where the most volume was traded relative to the current price action.
Key Features:
Dynamic POC (Yellow): Represents the price level with the highest traded volume within the rolling window. Acts as a dynamic center of gravity for price.
Dynamic Value Area (Blue/Red): Displays the Value Area High (VAH) and Value Area Low (VAL), representing the specified percentage (default 70%) of total volume.
EMA Smoothing: Applies an Exponential Moving Average smoothing to the raw profile levels to filter out noise and create clean, actionable lines similar to Bollinger Bands or Keltner Channels.
High Performance: Optimized loop calculations to prevent script timeouts while maintaining accuracy.
How to Use (Trading Strategy):
Trend Filter: Use the POC (Yellow line) as a dynamic trend baseline. Price holding above the POC suggests bullish sentiment; below suggests bearish control.
Mean Reversion: In ranging markets, price excursions outside the VAH (Blue) or VAL (Red) often result in a mean reversion rotation back towards the POC.
Volatility Compression: When the VAH and VAL lines contract (squeeze), it indicates a consolidation phase and potential energy buildup for a breakout.
Settings:
Lookback Period: Defines the sliding window size for the volume calculation.
Recommend: 50
Row Size: Adjusts the resolution of the price buckets (higher = more precision).
Value Area %: Standard is 70%, but can be adjusted (e.g., to 68% for 1 Standard Deviation).
Smoothing: Adjusts the EMA length applied to the final lines.
Recommend: 50
Color Legend:
🟡 POC: Yellow
🔵 VAH: Blue
🔴 VAL: Red
Credits: Script developed by David Kahlon – Specializing in Pine Script development for Futures & Algorithmic Trading systems.

CVD Volume Profile, Pivot AnchoredThe Ultimate Guide to CVD Volume Profile: Pivot Anchored:
Bridging Market Structure and Order Flow Analysis-
In the evolving landscape of technical analysis, the separation between "Price Action" traders and "Order Flow" traders is becoming increasingly blurred. The CVD Volume Profile, Pivot Anchored indicator represents the pinnacle of this convergence. It is not merely a volume indicator; it is a sophisticated algorithmic tool designed to decode the internal auction mechanics of the market.
By fusing Market Structure (Pivots), Auction Market Theory (Volume Profile), and Order Flow (Cumulative Volume Delta), this script offers a granular view of market sentiment that standard indicators cannot provide. This document serves as a comprehensive manual, theoretical framework, and strategic guide to understanding the algorithms, specialties, and superior utility of this tool.
1. The Data Mining Engine: Intrabar Granularity-
At the heart of this script lies a mechanism designed to solve the "guesswork" problem of standard volume indicators. Standard indicators see a 1-hour bar as a single block of data. This script uses a Micro-Timeframe Tunnelling technique.
The Request: The script sends a request to the server to fetch data from a lower timeframe (defaulting to 1 minute) for every single bar on your current chart.
The Reconstruction: It looks inside your current candle (e.g., a 1-hour bar) and pulls out the 60 individual 1-minute candles that created it.
The Intensity Logic: It analyzes these micro-candles individually. It determines "Buying Pressure" vs. "Selling Pressure" based on where the micro-candle closed relative to its high and low (the "Intrabar Intensity" method).
If the micro-candle closed near its high: It attributes the volume to Buying.
If it closed near its low: It attributes the volume to Selling.
The Aggregation: It sums up these dozens of micro-calculations to create a highly accurate profile of Buy vs. Sell volume for the main bar, rather than just guessing based on the final color of the main candle.
2. The Structural Skeleton: Dynamic Pivot Anchoring-
Most volume profiles are static (fixed to a time or a manual drawing). This algorithm is dynamic and reactive to Market Structure. Pivot Scanning: The script continuously scans price action looking for local "peaks" and "valleys." It uses a "Lookback/Lookforward" algorithm (checking N bars to the left and right) to confirm if a High is truly a structural High (Pivot).
The Anchor Event: Once a Pivot is mathematically confirmed, the script identifies this as a "Change of Behavior."
The Segmentation: It draws a virtual boundary line. It calculates a Volume Profile starting strictly from that Pivot point and ending at the next Pivot. This isolates the volume analysis to specific market "swings" or "legs," ensuring you are only analyzing the volume relevant to the current structural move.
3. The Binning Process: Profile Construction-
How does the script turn raw volume numbers into the horizontal histogram bars on your screen? It uses a Binning Algorithm.
Range Definition: For every specific swing (from Pivot A to Pivot B), the script finds the absolute Highest Price and Lowest Price.
Slicing: It divides this vertical price range into a specific number of equal horizontal "slices" or rows (user-defined, e.g., 30 rows).
Distribution Loop: The script runs a loop through every bar in that swing. It asks: "Which price slice did this bar trade in?"
Allocation: It takes the Buy/Sell volume calculated in Step 1 and deposits it into the corresponding "buckets" (arrays) for those price slices. If a bar spans multiple slices, the algorithm intelligently distributes the volume across them to avoid data clustering.
4. The Smart Filter: Volume Quality Control-
This is the noise-cancellation component of the algorithm.
The Baseline: The script calculates a Simple Moving Average (SMA) of volume to establish a "baseline" of normal activity.
The Threshold: It applies a multiplier (e.g., 1.5x) to that average to create a "Significance Threshold."
The Gatekeeper: As the script processes the data, it checks every bar against this threshold.
If a bar’s volume is below the threshold, the algorithm marks it as "Noise/Retail Chop" and excludes it from the Cumulative Volume Delta (CVD) calculation.
If a bar’s volume is above the threshold, it is marked as "Institutional/Smart Money" and added to the profile.
The Result: The final profile represents a map of high-conviction transactions only, stripping away the irrelevance of low-volume drift.
5. Statistical Geography: POC and Value Area-
Once the "buckets" are full of volume data, the script performs statistical analysis to draw the key lines.
Point of Control (POC) Search: The script scans the arrays to find the single index (row) containing the highest integer value. It marks this as the POC—the price most accepted by the market.
Value Area Expansion: It calculates the total volume of the entire profile. It then calculates 68% of that total (representing one Standard Deviation). Starting from the POC, the algorithm expands row-by-row, moving up and down, accumulating volume until it hits that 68% number. The top row of this accumulation becomes the Value Area High (VAH), and the bottom becomes the Value Area Low (VAL).
6. The Dual-State Processor-
Finally, the algorithm distinguishes between the Past and the Present.
Historical State: For completed swings (Pivot High to Pivot Low), it finalizes the calculation, draws the box, and locks it in place. It will not change.
Developing State: For the current market action (from the last Pivot to right now), the algorithm enters a "Live" state. It recalculates the bins, the POC, and the Value Area on every single price tick, allowing the trader to watch the levels migrate in real-time as new orders hit the book.
2. The Trinity of POCs
Standard tools give you one Point of Control (POC)—the price with the most volume. This script calculates three:
Total POC (Orange): The price level with the highest aggregate activity.
Buy POC (Green): The price level where buyers were most aggressive.
Sell POC (Red): The price level where sellers were most aggressive.
Strategic Insight:
Bullish Divergence: Price is at the Total POC, but the Buy POC is significantly higher. This indicates buyers are stepping up and accepting higher prices.
Bearish Divergence: Price is rising, but the Sell POC remains lower, suggesting the move up lacks support and sellers are waiting below.
3. Delta Imbalance Bars
Look for the bright purple bars protruding from specific rows.
Function: These bars visualize the Net Delta (Buy Volume minus Sell Volume).
Usage: They highlight "Imbalance Levels." If you see a massive Positive Delta bar at a swing high, but the candle closed bearishly, it indicates "Trapped Buyers."
4. Developing Profile vs. Historical Profile
Historical Profiles: Located at previous pivot points. These are static and show the history of that specific swing.
Developing Profile: Attached to the current price action (right side of the screen). This updates in real-time, allowing you to see the POC migrate tick-by-tick.
Text Overlay: The developing profile features a text dashboard showing exact "Buy | Sell | Delta" numbers for the current row, providing a microscopic view of the current battle.
5. Volume Weighted Colored Bars (VWCB)
The script colors the main candlesticks based on volume and delta.
Dark Green/Red: High Volume + High Delta Directional move (Conviction).
Bright Orange/Cyan: Low Volume (Indecision/Drift).
Bright Green/Red: Normal Volume.
Part 3: Superiority Over Existing Volume Profiles
Why should a trader switch from the native TradingView "Fixed Range Volume Profile" (FRVP) to the CVD Pivot Anchored Profile?
1. Context vs. Convenience
Existing Tools: FRVP requires manual drawing. Every time the market makes a new leg, you must delete your old tool and draw a new one.
CVD Pivot Profile: It is autonomous. It flows with the market rhythm. It recognizes that the relevance of volume data resets when market structure breaks. It automates the workflow of a professional trader.
2. The "Who" Factor
Existing Tools: Show you that 1M shares traded at $100.
CVD Pivot Profile: Shows you that of those 1M shares, 800k were aggressive sells and 200k were buys.
The Edge: Knowing the composition of the volume prevents getting trapped. A high-volume breakout level is usually seen as support. However, if this tool reveals that the volume at the breakout was 90% selling (into passive limit orders), you know that level is actually resistance, not support.
3. Data Resolution
Existing Tools: Most user-created Pine Scripts rely on close > open logic to determine buy/sell volume, which is statistically roughly 60% accurate.
CVD Pivot Profile: By leveraging request.security_lower_tf("1"), the accuracy jumps significantly, approaching the fidelity of professional order flow platforms like Sierra Chart or NinjaTrader, directly within the browser.
4. Noise Reduction
Existing Tools: Count every single trade, cluttering the view with insignificant data from pre-market or lunch hours.
CVD Pivot Profile: The Volume Filter feature allows you to see the market through the eyes of an institution. You can literally toggle off the "retail noise" and trade only against the levels created by whales.
Part 4: Strategic Application Guide
How to trade profitably using this script.
Strategy A: The Value Area Rejection (Mean Reversion)
Theory: 70% of volume occurs within the Value Area (VA). When price moves outside the VA (VA High or VA Low) without volume support, it is likely to revert to the POC.
Identify: Price moves above the Value Area High (VAH).
Confirm: Look at the Delta Bar at the high. Is it small or negative? This indicates a lack of buyers driving the breakout.
Trigger: Price closes back inside the VAH.
Target: The Total POC or the opposite side of the Value Area (VAL).
Strategy B: The POC Migration Trend (Continuation)
Theory: In a healthy trend, the Point of Control (POC) should migrate in the direction of the trend.
Identify: An uptrend where new pivots are forming.
Observe: Look at the Buy POC of the current developing profile vs. the Buy POC of the previous historical profile.
Condition: If the Buy POC is stepping higher and the Buy Profile (Teal side) is thicker than the Sell Profile (Red side), the trend is healthy.
Entry: Wait for a retracement to the developing Buy POC.
Stop Loss: Below the Value Area Low.
Strategy C: The Absorption Reversal
Theory: High effort (Volume) with low result (Price movement) equals a reversal.
Identify: Price crashes into a support level.
Observe: The Sell Profile (Red) expands massively, becoming very wide. The Volume Weighted Colored Bar is dark red (High Volume).
The Clue: Despite the massive sell volume, the Delta Imbalance is shrinking, or price forms a wick.
Logic: Sellers are dumping, but passive buyers are absorbing 100% of the orders. The sellers are running out of ammunition.
Entry: When price ticks above the Sell POC of that specific cluster.
Strategy D: The Volume Filter Breakout
Theory: Breakouts require institutional participation to sustain.
Setup: Enable Filter Volume in settings. Set Multiplier to 1.5 or 2.0.
Scenario: Price breaks a key resistance level.
Verification: Does the breakout candle have a corresponding Diamond Marker (Volume Filter Pass)?
Action:
Yes: Valid breakout. Institutional money is present. Enter on retest.
No: False breakout. The move lacks conviction. Fade the move (short).
Part 5: Configuration and Inputs Guide
To get the most out of this script, understanding the settings is crucial.
Group: Main Settings
Pivot Points Left/Right Length (Default: 20): This determines the sensitivity of the anchors.
Lower (e.g., 10): More frequent resets, good for scalping.
Higher (e.g., 60): Shows major structural swings, good for swing trading.
Number of Rows (Default: 30): The resolution of the profile. Higher numbers give more detail but can look cluttered. 30-50 is the sweet spot.
Value Area Volume % (Default: 68): Standard deviation logic. Keep at 68-70% for standard auction theory, or 100% to see the full range.
Lower Timeframe for CVD (Default: 1): The timeframe used for intrabar calculation. Keep at "1" for 1-minute precision. Increasing this reduces accuracy but loads faster.
Group: Volume Filter
Filter Volume: Toggles the noise reduction engine.
Filter Period: The length of the SMA used to determine average volume.
Filter Multiplier: The threshold. 1.0 = Average. 2.0 = Double the average.
Recommendation: Start with 1.5 to filter out standard activity and highlight spikes.
Group: Buy/Sell/Total Profiles
Show Buy/Sell Profile: Toggles the split visualization.
Extend POC: This is a powerful feature.
Until Bar Cross: Extends the POC line forward until price interacts with it. This leaves "Unnaked POCs" on the chart, which act as high-probability magnets for future price action.
Group: Delta Imbalance
Significant Imbalance Ratio (Default: 1.5): Defines when to highlight a level. If Buy Volume is 1.5x greater than Sell Volume, it triggers an imbalance highlight.
Conclusion
The CVD Volume Profile, Pivot Anchored script is a paradigm shift in technical analysis on TradingView. It moves the trader away from lagging indicators (RSI, MACD) and reactive tools (Standard Volume) toward a proactive, data-rich understanding of the market.
It answers the fundamental questions of trading:
Where is the value? (Value Area & POCs)
Who is in control? (Buy vs. Sell Profiles)
Are they committed? (Volume Filter & Delta)
Is the move sustainable? (Intrabar Intensity)
By anchoring this data to the natural pivots of market structure, it ensures that your analysis is always contextually synchronized with the current market rhythm. For the day trader, scalper, or swing trader looking to gain an institutional edge, this script provides the X-Ray vision necessary to see through the candles and into the order flow.

Dual Volume Profiles: Session + Rolling (Range Delineation)Dual Volume Profiles: Session + Rolling (Range Delineation)
INTRO
This is a probability-centric take on volume profile. I treat the volume histogram as an empirical PDF over price, updated in real time, which makes multi-modality (multiple acceptance basins) explicit rather than assumed away. The immediate benefit is operational: if we can read the shape of the distribution, we can infer likely reversion levels (POC), acceptance boundaries (VAH/VAL), and low-friction corridors (LVNs).
My working hypothesis is that what traders often label “fat tails” or “power-law behavior” at short horizons is frequently a tail-conditioned view of a higher-level Gaussian regime. In other words, child distributions (shorter periodicities) sit within parent distributions (longer periodicities); when price operates in the parent’s tail, the child regime looks heavy-tailed without being fundamentally non-Gaussian. This is consistent with a hierarchical/mixture view and with the spirit of the central limit theorem—Gaussian structure emerges at aggregate scales, while local scales can look non-Gaussian due to nesting and conditioning.
This indicator operationalizes that view by plotting two nested empirical PDFs: a rolling (local) profile and a session-anchored profile. Their confluence makes ranges explicit and turns “regime” into something you can see. For additional nesting, run multiple instances with different lookbacks. When using the default settings combined with a separate daily VP, you effectively get three nested distributions (local → session → daily) on the chart.
This indicator plots two nested distributions side-by-side:
Rolling (Local) Profile — short-window, prorated histogram that “breathes” with price and maps the immediate auction.
Session Anchored Profile — cumulative distribution since the current session start (Premkt → RTH → AH anchoring), revealing the parent regime.
Use their confluence to identify range floors/ceilings, mean-reversion magnets, and low-volume “air pockets” for fast traverses.
What it shows
POC (dashed): central tendency / “magnet” (highest-volume bin).
VAH & VAL (solid): acceptance boundaries enclosing an exact Value Area % around each profile’s POC.
Volume histograms:
Rolling can auto-color by buy/sell dominance over the lookback (green = buying ≥ selling, red = selling > buying).
Session uses a fixed style (blue by default).
Session anchoring (exchange timezone):
Premarket → anchors at 00:00 (midnight).
RTH → anchors at 09:30.
After-hours → anchors at 16:00.
Session display span:
Session Max Span (bars) = 0 → draw from session start → now (anchored).
> 0 → draw a rolling window N bars back → now, while still measuring all volume since session start.
Why it’s useful
Think in terms of nested probability distributions: the rolling node is your local Gaussian; the session node is its parent.
VA↔VA overlap ≈ strong range boundary.
POC↔POC alignment ≈ reliable mean-reversion target.
LVNs (gaps) ≈ low-friction corridors—expect quick moves to the next node.
Quick start
Add to chart (great on 5–10s, 15–60s, 1–5m).
Start with: bins = 240, vaPct = 0.68, barsBack = 60.
Watch for:
First test & rejection at overlapping VALs/VAHs → fade back toward POC.
Acceptance beyond VA (several closes + growing outer-bin mass) → traverse to the next node.
Inputs (detailed)
General
Lookback Bars (Rolling)
Count of most-recent bars for the rolling/local histogram. Larger = smoother node that shifts slower; smaller = more reactive, “breathing” profile.
• Typical: 40–80 on 5–10s charts; 60–120 on 1–5m.
• If you increase this but keep Number of Bins fixed, each bin aggregates more volume (coarser bins).
Number of Bins
Vertical resolution (price buckets) for both rolling and session histograms. Higher = finer detail and crisper LVNs, but more line objects (closer to platform limits).
• Typical: 120–240 on 5–10s; 80–160 on 1–5m.
• If you hit performance or object limits, reduce this first.
Value Area %
Exact central coverage for VAH/VAL around POC. Computed empirically from the histogram (no Gaussian assumption): the algorithm expands from POC outward until the chosen % is enclosed.
• Common: 0.68 (≈“1σ-like”), 0.70 for slightly wider core.
• Smaller = tighter VA (more breakout flags). Larger = wider VA (more reversion bias).
Max Local Profile Width (px)
Horizontal length (in pixels) of the rolling bars/lines and its VA/POC overlays. Visual only (does not affect calculations).
Session Settings
RTH Start/End (exchange tz)
Defines the current session anchor (Premkt=00:00, RTH=your start, AH=your end). The session histogram always measures from the most recent session start and resets at each boundary.
Session Max Span (bars, 0 = full session)
Display window for session drawings (POC/VA/Histogram).
• 0 → draw from session start → now (anchored).
• > 0 → draw N bars back → now (rolling look), while still measuring all volume since session start.
This keeps the “parent” distribution measurable while letting the display track current action.
Local (Rolling) — Visibility
Show Local Profile Bars / POC / VAH & VAL
Toggle each overlay independently. If you approach object limits, disable bars first (POC/VA lines are lighter).
Local (Rolling) — Colors & Widths
Color by Buy/Sell Dominance
Fast uptick/downtick proxy over the rolling window (close vs open):
• Buying ≥ Selling → Bullish Color (default lime).
• Selling > Buying → Bearish Color (default red).
This color drives local bars, local POC, and local VA lines.
• Disable to use fixed Bars Color / POC Color / VA Lines Color.
Bars Transparency (0–100) — alpha for the local histogram (higher = lighter).
Bars Line Width (thickness) — draw thin-line profiles or chunky blocks.
POC Line Width / VA Lines Width — overlay thickness. POC is dashed, VAH/VAL solid by design.
Session — Visibility
Show Session Profile Bars / POC / VAH & VAL
Independent toggles for the session layer.
Session — Colors & Widths
Bars/POC/VA Colors & Line Widths
Fixed palette by design (default blue). These do not change with buy/sell dominance.
• Use transparency and width to make the parent profile prominent or subtle.
• Prefer minimal? Hide session bars; keep only session VA/POC.
Reading the signals (detailed playbook)
Core definitions
POC — highest-volume bin (fair price “magnet”).
VAH/VAL — upper/lower bounds enclosing your Value Area % around POC.
Node — contiguous block of high-volume bins (acceptance).
LVN — low-volume gap between nodes (low friction path).
Rejection vs Acceptance (practical rule)
Rejection at VA edge: 0–1 closes beyond VA and no persistent growth in outer bins.
Acceptance beyond VA: ≥3 closes beyond VA and outer-bin mass grows (e.g., added volume beyond the VA edge ≥ 5–10% of node volume over the last N bars). Treat acceptance as regime change.
Confluence scores (make boundary/target quality objective)
VA overlap strength (range boundary):
C_VA = 1 − |VA_edge_local − VA_edge_session| / ATR(n)
Values near 1.0 = tight overlap (stronger boundary).
Use: if C_VA ≥ 0.6–0.8, treat as high-quality fade zone.
POC alignment (magnet quality):
C_POC = 1 − |POC_local − POC_session| / ATR(n)
Higher C_POC = greater chance a rotation completes to that fair price.
(You can estimate these by eye.)
Setups
1) Range Fade at VA Confluence (mean reversion)
Context: Local VAL/VAH near Session VAL/VAH (tight overlap), clear node, local color not screaming trend (or flips to your side).
Entry: First test & rejection at the overlapped band (wick through ok; prefer close back inside).
Stop: A tick/pip beyond the wider of the two VA edges or beyond the nearest LVN, a small buffer zone can be used to judge whether price is truly rejecting a VAL/VAH or simply probing.
Targets: T1 node mid; T2 POC (size up when C_POC is high).
Flip: If acceptance (rule above) prints, flip bias or stand down.
2) LVN Traverse (continuation)
Context: Price exits VA and enters an LVN with acceptance and growing outer-bin volume.
Entry: Aggressive—first close into LVN; Conservative—retest of the VA edge from the far side (“kiss goodbye”).
Stop: Back inside the prior VA.
Targets: Next node’s VA edge or POC (edge = faster exits; POC = fuller rotations).
Note: Flatter VA edge (shallower curvature) tends to breach more easily.
3) POC→POC Magnet Trade (rotation completion)
Context: Local POC ≈ Session POC (high C_POC).
Entry: Fade a VA touch or pullback inside node, aiming toward the shared POC.
Stop: Past the opposite VA edge or LVN beyond.
Target: The shared POC; optional runner to opposite VA if the node is broad and time-of-day is supportive.
4) Failed Break (Reversion Snap-back)
Context: Push beyond VA fails acceptance (re-enters VA, outer-bin growth stalls/shrinks).
Entry: On the re-entry close, back toward POC.
Stop/Target: Stop just beyond the failed VA; target POC, then opposite VA if momentum persists.
How to read color & shape
Local color = most recent sentiment:
Green = buying ≥ selling; Red = selling > buying (over the rolling window). Treat as context, not a standalone signal. A green local node under a blue session VAH can still be a fade if the parent says “over-valued.”
Shape tells friction:
Fat nodes → rotation-friendly (fade edges).
Sharp LVN gaps → traversal-friendly (momentum continuation).
Time-of-day intuition
Right after session anchor (e.g., RTH 09:30): Session profile is young and moves quickly—treat confluence cautiously.
Mid-session: Cleanest behavior for rotations.
Close / news: Expect more traverses and POC migrations; tighten risk or switch playbooks.
Risk & execution guidance
Use tight, mechanical stops at/just beyond VA or LVN. If you need wide stops to survive noise, your entry is late or the node is unstable.
On micro-timeframes, account for fees & slippage—aim for targets paying ≥2–3× average cost.
If acceptance prints, don’t fight it—flip, reduce size, or stand aside.
Suggested presets
Scalp (5–10s): bins 120–240, barsBack 40–80, vaPct 0.68–0.70, local bars thin (small bar width).
Intraday (1–5m): bins 80–160, barsBack 60–120, vaPct 0.68–0.75, session bars more visible for parent context.
Performance & limits
Reuses line objects to stay under TradingView’s max_lines_count.
Very large bins × multiple overlays can still hit limits—use visibility toggles (hide bars first).
Session drawings use time-based coordinates to avoid “bar index too far” errors.
Known nuances
Rolling buy/sell dominance uses a simple uptick/downtick proxy (close vs open). It’s fast and practical, but it’s not a full tape classifier.
VA boundaries are computed from the empirical histogram—no Gaussian assumption.
This script does not calculate the full daily volume profile. Several other tools already provide that, including TradingView’s built-in Volume Profile indicators. Instead, this indicator focuses on pairing a rolling, short-term volume distribution with a session-wide distribution to make ranges more explicit. It is designed to supplement your use of standard or periodic volume profiles, not replace them. Think of it as a magnifying lens that helps you see where local structure aligns with the broader session.
How to trade it (TL;DR)
Fade overlapping VA bands on first rejection → target POC.
Continue through LVN on acceptance beyond VA → target next node’s VA/POC.
Respect acceptance: ≥3 closes beyond VA + growing outer-bin volume = regime change.
FAQ
Q: Why 68% Value Area?
A: It mirrors the “~1σ” idea, but we compute it exactly from empirical volume, not by assuming a normal distribution.
Q: Why are my profiles thin lines?
A: Increase Bars Line Width for chunkier blocks; reduce for fine, thin-line profiles.
Q: Session bars don’t reach session start—why?
A: Set Session Max Span (bars) = 0 for full anchoring; any positive value draws a rolling window while still measuring from session start.
Changelog (v1.0)
Dual profiles: Rolling + Session with independent POC/VA lines.
Session anchoring (Premkt/RTH/AH) with optional rolling display span.
Dynamic coloring for the rolling profile (buying vs selling).
Fully modular toggles + per-feature colors/widths.
Thin-line rendering via bar line width.

Swing Volume Profiles [LuxAlgo]The Swing Volume Profiles indicator aims to calculate and highlight trading activity at specific price levels between two swing points; allowing traders to reveal dominant and/or significant price levels based on volume.
By measuring traded volume at all price levels in the market over a specified time period, the script can also be used to detect some key analysis generally such as supply & demand, buy-side & sell-side liquidity levels, unfilled liquidity voids, and imbalances that can highlight on the chart.
🔶 USAGE
A volume profile is an advanced charting tool that displays the traded volume at different price levels over a specific period. It helps you visualize where the majority of trading activity has occurred.
Key Levels are the areas where the volume is concentrated or where there are significant volume spikes. These levels are known as key support and resistance levels. High-volume nodes indicate areas of high activity and are likely to act as support or resistance in the future.
Volume profile also helps identify value areas, which represent the price levels where the most trading activity has taken place. These levels can act as areas of support or resistance as traders perceive them as fair value.
The Point of Control describes the price level where the most volume was traded. A Naked Point of Control (also called a Virgin Point of Control) is a previous POC that has not been traded. Extending PoC options 'Until Bar Cross' or 'Until Bar Touch' helps in identifying Naked Point of Control Lines.
Previous PoC levels can serve as support and resistance for future price movements. Extending PoC Level 'Until Last Bar' option will help to identify such levels.
🔶 DETAILS
One of the unique features of the script is its ability to detect some other key levels such as levels of acceptance and rejection.
Levels of rejection we may summarize as supply and demand levels, these are also referred to as buy-side and sell-side liquidity levels. They usually occur at extreme highs or lows, where prices may be too high for buyers (high supply, low demand) or too low for sellers (low supply, high demand)
Levels of acceptance are the levels where Liquidity Voids occur, these are also referred to imbalances. Liquidity voids are sudden changes in price when the price jumps from one level to another. The peculiar thing about liquidity voids is that they almost always fill up, so we call them levels of acceptance.
🔶 ALERTS
When an alert is configured, the user will have the ability to be notified in case:
Point Of Control Line is touched/crossed
Value Area High Line is touched/crossed
Value Area Low Line is touched/crossed
🔶 SETTINGS
🔹 Display Options
Mode: Controls the lookback length of detection and visualization, where Present assumes last X bars specifid in '# Bars' option and Historical assumes all data available to the user as well as allowed limits of visiual objects (boxs, lines, labels etc)
# Bars: Controls the lookback length.
🔹 Swing Volume Profiles
The script takes into account user-defined parameters and plots volume profiles. Due to Pine Script™ drwaing objects limit only total volume profiles are presented.
Swing Detection Length: Lookback period
Swing Volume Profiles: Toggles the visibility of the Volume Profiles, with color options to differentiate the Value Area within a profile.
Profile Range Background Fill: Toggles the visibility of the Volume Profiles Range
🔹 Point of Control (PoC)
Point of Control (POC) – The price level for the time period with the highest traded volume
Point of Control (PoC): Toggles the visibility of the Point of Control
Developing PoC: Toggles the visibility of the Developing PoC
Extend PoC: Option that allows detecting virgin PoC levels. Virgin Point of Control (VPoC) is defined as a Point of Control that has never been revisited or touched. The option also allows PoC levels to extend till the last bar aiming to present levels from history where the levels were traded significantly and those levels can be used as support and resistance levels.
🔹 Value Area (VA)
Value Area (VA) – The range of price levels in which the specified percentage of all volume was traded during the time period.
Value Area Volume %: Specifies percentage of the Value Area
Value Area High (VAH): Toggles the visibility of the Value Area High, the highest price level within the Value Area
Value Area Low (VAL): Toggles the visibility of the Value Area Low, the lowest price level within the Value Area
Value Area (VA) Background Fill: Toggles the visibility of the Value Area Range
🔹 Liquidity Levels / Voids
Unfilled Liquidity, Thresh: Enable display of the Unfilled Liquidity Levels and Liquidity Voids, where threshold value defines the significance of the level.
🔹 Profile Stats
Position, Size: Specifies the position and the size of the label presenting Profile Stats, the tooltip of the label includes all related info for each profile.
Price, Price Change, and Cumulative Volume: Enable display of the given options on the chart.
🔹 Volume Profile Others
Number of Rows: Specify how many rows each histogram will have. Caution, having it set to high values will quickly hit Pine Script™ drawing objects limit and may cause fewer historical profiles to be displayed.
Placement: Place profile either left or right.
Profile Width %: Alters the width of the rows in the histogram, relative to the calculated profile length.
🔶 RELATED SCRIPTS
Alternative Liquidity Void Detection script, Buyside-Sellside-Liquidity

VWAP Volume Profile [BigBeluga]🔵 OVERVIEW
VWAP Volume Profile is an advanced hybrid of the VWAP and volume profile concepts. It visualizes how volume accumulates relative to VWAP movement—separating rising (+VWAP) and declining (−VWAP) activity into two mirrored horizontal profiles. It highlights the dominant price bins (POCs) where volume peaked during each directional phase, helping traders spot hidden accumulation or distribution zones.
🔵 CONCEPTS
VWAP-Driven Profiling: Unlike standard volume profiles, this tool segments volume based on VWAP movement—accumulating positive or negative volume depending on VWAP slope.
Dual-Sided Profiles: Profiles expand horizontally to the right of price. Separate bins show rising (+) and falling (−) VWAP volume.
Bin Logic: Volume is accumulated into defined horizontal bins based on VWAP’s position relative to price ranges.
Gradient Coloring: Volume bars are colored with a dynamic gradient to emphasize intensity and direction.
POC Highlighting: The highest-volume bin in each profile type (+/-) is marked with a transparent box and label.
Contextual VWAP Line: VWAP is plotted and dynamically colored (green = rising, orange = falling) for instant trend context.
Candle Overlay: Price candles are recolored to match the VWAP slope for full visual integration.
🔵 FEATURES
Dual-sided horizontal volume profiles based on VWAP slope.
Supports rising VWAP , falling VWAP , or both simultaneously.
Customizable number of bins and lookback period.
Dynamically colored VWAP line to show rising/falling bias.
POC detection and labeling with volume values for +VWAP and −VWAP.
Candlesticks are recolored to match VWAP bias for intuitive momentum tracking.
Optional background boxes with customizable styling.
Adaptive volume scaling to normalize bar length across markets.
🔵 HOW TO USE
Use POC zones to identify high-volume consolidation areas and potential support/resistance levels.
Watch for shifts in VWAP direction and observe how volume builds differently during uptrends and downtrends.
Use the gradient profile shape to detect accumulation (widening volume below price) or distribution (above price).
Use candle coloring for real-time confirmation of VWAP bias.
Adjust the profile period or bin count to fit your trading style (e.g., intraday scalping or swing trading).
🔵 CONCLUSION
VWAP Volume Profile merges two essential concepts—volume and VWAP—into a single, high-precision tool. By visualizing how volume behaves in relation to VWAP movement, it uncovers hidden dynamics often missed by traditional profiles. Perfect for intraday and swing traders who want a more nuanced read on market structure, trend strength, and volume flow.

Zig-Zag Volume Profile (Bull vs. Bear) [Kioseff Trading]Hello!
Thank you @Pinecoders and @TradingView for putting polylines in production and making this viable!!
This script "Zig Zag Volume Profile" implements the polyline feature for Pine Script!
Features
Volume Profile anchored to zig zag trends
Bull vs Bear profiles!
Delta x price level
Standard POC and value area lines, in addition to separated POCs and value area lines for bull profiles and bear profiles
Up to 9999 profile rows per zigzag trend
Stylistic options for profiles
Configurable zig zag - profiles generated for small to large trends
Polylines!
This script generates Bull vs. Bear volume profiles for zig zag trends!
The zigzag indicator is configurable as normal; minor and major trend volume profiles are calculable. This indicator can be thought of as "Volume Profile/Delta for Trends''.
Up to 9999 volume profile levels (price levels) can be calculated for each profile, thanks to the new polyline feature, allowing for less aggregation / more precision of volume at price and volume delta.
Zig Zag Bull Vs Bear Profiles
The image above shows primary functionality!
Green profiles = buying volume
Red profiles = selling volume
Profiles are generated for each trend identified by the zigzag indicator.
The image above shows the indicator calculating volume delta for specific price blocks on the profile. Aggregate volume delta for the identified trend is displayed over the profile!
The image above shows Bull Profile POC lines and value area lines. Bear Profile POC lines and value area lines are also shown!
All colors and transparencies are configurable to the user's liking :D
Additionally, you can select to have the profiles drawn on contrasting sides. Bull Profile on left and Bear Profile on right.
For a more traditional look - you can select to draw the Bull & Bear profiles on the same x-point.
The indicator is robust enough to calculate on "long zig zags" and "short zig zags"; curved profiles can also be used!
The image above exemplifies usage of the indicator!
Bull & Bear volume profiles are calculated for trends on the 30-second timeframe.
The image above shows a more "utilitarian" presentation of the profiles. Once more, line and linefill colors/transparencies are all customizable; the indicator can look however you would like it to!
The image above shows key levels, the Bull vs. Bear profile, and volume delta for the current trend!
That's about it :D
This indicator is part of a series titled "Bull vs. Bear" - a suite of profile-like indicators I will be releasing over coming days. Thanks for checking this out!
Of course, a big thank you to @RicardoSantos for his MathOperator library that I use in every script.
If you have any suggestions please feel free to share!

Multi-Session Volume Profile Suite [MarkitTick]💡 This indicator provides a sophisticated, institutional-grade Volume Profile analysis suite that renders multiple temporal profiles simultaneously. It is designed for traders utilizing Auction Market Theory who require a holistic view of where value is being established across Daily, Weekly, and Monthly timeframes, alongside custom intraday sessions. By bypassing standard built-in functions in favor of a custom array-based calculation engine, this tool offers granular control over Value Area logic, Point of Control (POC) migration, and multi-timeframe confluence detection.
✨ Originality and Utility
Standard Volume Profile tools often limit traders to a single timeframe or the visible range of the chart. This creates a fragmented view of the market, where a trader might see the daily value but miss the context of the weekly or monthly auction.
This script solves that problem by layering three distinct higher-timeframe profiles (Daily, Weekly, Monthly) plus three customizable intraday session profiles onto a single chart.
● Key Differentiators
Confluence Detection Engine: The script mathematically calculates when the Points of Control (POC) of different timeframes overlap (e.g., Daily POC inside Weekly POC). It explicitly highlights these high-probability zones with specific labels (e.g., "TRIPLE CONFLUENCE"), automating the search for key support/resistance levels.
POC Migration Tracking: Unlike static profiles, this tool tracks the "Shift" of the POC. It visualizes whether value is migrating higher (▲), lower (▼), or remaining neutral (=) compared to the previous period, providing immediate insight into the trend's acceptance.
Synthetic Chart Protection: The script includes logic to detect and prevent usage on non-standard chart types like Heikin Ashi or Renko, ensuring that the volume data processed is accurate and not subject to the repainting often found in synthetic OHLC variations.
🔬 Methodology and Concepts
The core engine relies on a custom implementation of the Volume Profile formula using dynamic arrays. It does not simply pull pre-calculated data but processes the tick volume of the underlying asset relative to price action.
• Volumetric Binning
The script divides the price range of a specific period (e.g., a Day) into a user-defined number of "rows" (bins). As price trades within a specific bin, the corresponding volume is accumulated.
Point of Control (POC): The bin with the highest accumulated volume is identified as the POC. This represents the "Fair Value" or the mode of the distribution for that period.
Value Area (VA): The script calculates the total volume of the profile and then identifies the range surrounding the POC that contains a specific percentage (default 70%) of that volume. It uses a dual-scanning algorithm that expands upwards or downwards from the POC based on which adjacent row has higher volume, mimicking the auction process of testing prices.
• Exact-Anchor Pivots
Simultaneously, the script tracks "Exact-Anchor" pivots. Unlike standard pivots that settle at the close, these track the absolute High and Low of the period (Daily/Weekly/Monthly) in real-time and extend them until a new period begins.
🎨 Visual Guide
The indicator uses a color-coded hierarchy to distinguish between timeframes. Understanding this visual language is critical for interpreting the data.
● Profile Hierarchy (Default Theme)
Daily Profile (Yellow/Gold): Represents the immediate, short-term auction.
Solid Line: Daily POC.
Dotted Line: Daily Value Area High (VAH) and Low (VAL).
Weekly Profile (Blue): Represents the intermediate auction. A solid Blue line indicates the Weekly POC.
Monthly Profile (Purple): Represents the macro auction. A solid Purple line indicates the Monthly POC.
● Labels and Symbols
Right-Side Labels: At the end of profile lines, text labels display the exact price of the POC.
Shift Arrows (▲ / ▼): Located inside the POC label, these arrows indicate the direction the POC has moved relative to the previous period's POC. An Up arrow (▲) suggests buyers are accepting higher prices.
Confluence Labels: If enabled, a text box appears near price action stating "POC CONFLUENCE" or "TRIPLE CONFLUENCE" when the POCs of different timeframes align within a tight margin.
Block Symbol (⬛): A small block icon may appear above bars to denote the center of a specific session's time window.
● Pivot Lines
Orange Lines: Previous Daily High (PDH) and Low (PDL).
Green Dashed Lines: Previous Weekly High (PWH) and Low (PWL).
Red Dotted Lines: Previous Monthly High (PMH) and Low (PML).
White Dashed Line: New York Midnight Open price (if enabled).
📖 How to Use
This suite is designed for "Contextual Trading." It answers the question: Where are we relative to value?
• Trend Acceptance
Observe the Shift Arrows on the POC labels. In a healthy uptrend, you should see a sequence of Daily and Weekly profiles with (▲) arrows, indicating that the market is validating higher prices as fair value. If price rises but the POC remains lower or shifts down, it may indicate a "weak high" or a potential reversal (divergence between price and value).
• Support and Resistance
The POC lines act as high-probability support and resistance. Price returning to a Weekly (Blue) or Monthly (Purple) POC often results in a reaction, as these are areas of significant historical agreement between buyers and sellers.
• The Confluence Play
Pay special attention when the "Confluence" label appears. When a Daily POC aligns with a Weekly or Monthly POC, that specific price level possesses reinforced structural importance. A rejection from such a level is a strong signal; a breakout through such a level often leads to an explosive move as value transitions rapidly.
⚙️ Inputs and Settings
The script is highly customizable via the settings menu.
● General Settings
Row Resolution: Determines the granularity of the profile. Higher numbers (e.g., 100) create smoother, more detailed profiles but use more calculation resources.
Value Area %: Default is 70.0, representing the standard deviation of value.
Show POC Shift: Toggles the (▲/▼) comparison logic.
● Profile Scope
Show Daily/Weekly/Monthly: Checkboxes to individually enable or disable specific timeframe profiles.
Session Lookback: Controls how many historical days/weeks the profiles are kept on the chart.
● Pivots (PDH/PMH/NYM)
Show Pivots: Enables the High/Low lines for previous periods.
Show NY Midnight: Specifically toggles the opening price of the New York session (00:00 EST).
● Alerts
Approach Distance: Sets the sensitivity (in ticks) for alerts when price nears a key POC level.
🔍 Deconstruction of the Underlying Scientific and Academic Framework
This indicator is grounded in Auction Market Theory (AMT) and statistical distribution analysis.
• The Market as a Mechanism
AMT postulates that the primary purpose of the market is to facilitate trade. Price advertises opportunity, while Time regulates the opportunity. Volume is the validation of that price. When the market spends significant time and transacts significant volume at a specific level, it establishes "Value."
• Gaussian Distribution and Central Limit Theorem
A Volume Profile is essentially a histogram of volume over price, often resembling a Gaussian (Normal) Distribution or "Bell Curve" when the market is balanced.
POC (Mode): The peak of the curve. Mathematically, this is the mode of the dataset—the price occurring with the highest frequency (volume).
Value Area (Standard Deviation): In a normal distribution, approximately 68.2% of data points fall within one standard deviation of the mean. This script defaults to a 70% Value Area to approximate this statistical boundary. Prices outside this area are considered statistically significant anomalies or "imbalanced."
• Confluence and Probability
The "Confluence" feature leverages the intersection of independent datasets. If the mode (POC) of a short-term distribution (Daily) aligns with the mode of a long-term distribution (Weekly), the probability of that price representing "True Value" increases exponentially. This aligns with statistical principles where overlapping data clusters suggest a stronger underlying signal amidst market noise.
⚠️ Disclaimer
All provided scripts and indicators are strictly for educational exploration and must not be interpreted as financial advice or a recommendation to execute trades. I expressly disclaim all liability for any financial losses or damages that may result, directly or indirectly, from the reliance on or application of these tools. Market participation carries inherent risk where past performance never guarantees future returns, leaving all investment decisions and due diligence solely at your own discretion.

ZigZag Volume Profile [Honestcowboy]The ZigZag Volume Profile Indicator is a combination of 2 very popular trading indicators, the volume profile and zigzag indicator. Instead of using predetermined sessions like traditional volume profile analysis. This indicator expands on zigzag indicators "legs" and draws a volume profile inside each zigzag leg.
What is a Volume Profile?
"Technical analysis tool showing trading volume at specific price levels, creating a horizontal histogram on the side of a chart to reveal areas of high buying/selling interest, unlike traditional volume bars showing volume over time. Key elements include the Point of Control (POC) for most traded price, the Value Area (VAH/VAL), identifying crucial support/resistance, and analyzing profile shapes (like D, B, P) to understand market balance and potential price targets, used by professionals to spot liquidity and market structure."
Key Differences
Does not have a value area but distinguishes each column in relation to the biggest column in percentage terms.
Does not take sessions into account instead using zigzag legs
🟦 CALCULATION
The zigzag volume profile first builds a standard zigzag indicator to find structure in the market. Using pivot points and a minimum % price move threshhold.
Then once it knows the zigzags it will use each leg as a time window to calculate a volume profile inside.
🔹Coloring each column:
The script will find the biggest column in the Profile and use that as a reference for all other columns. It will then decide for each column individually how big it is in % compared to the biggest column. It will use that percentage to decide which color to give it, top 20% will be red, top 40% purple, top 60% blue, top 80% green and all the rest yellow. The user is able to adjust these numbers for further customisation.
🟦 USAGE
The idea behind this indicator is, if you look at markets as different legs (moves) going in a zigzag pattern you might want to look deeper inside your previous moves and see where the actual liquidity/volume was during that move. The hypothesis here is you build trade ideas based on zigzags but then use the volume profiles.
Since volume and market structure are very well known concepts to discretionary traders I'm hoping this indicator might give some different perspective on this relation and help people create a trading approach based on it. Here's some quick cherry picked examples, just as a proof of concept:
🟦 SETTINGS
🔹ZIGZAG SETTINGS
Price Deviotion % : This is the minimum price move in % term from last pivot price needs to move to form a new pivot for the zigzag.
Pivot Legs (Left/Right): The amount of bars a high or a low needs to be higher/lower than to the left and right of the bar. 10 By default to create medium term zigzag
🔹Volume Profile
Profile Rows: The amount of rows in Y axis the zigzag is going to be sliced into to create the volume profile. Higher number is more detailed volume profile but also uses more box objects which is maxed at 500. 25 by default
Profiles to Display: The amount of volume profiles the indicator will draw back in time. Higher number means more history but also longer loading time. 20 by default
🔹Visual Settings
This part is pretty self explanatory and you have can manually select the colors used to create the volume profile. Refer back the the explanation about the "🔹coloring each column" section.

Multi-Timeframe Volume Profile - Auto HVN WallsMulti-Timeframe Volume Profile - Auto HVN Walls
Overview This indicator provides a highly flexible Volume Profile solution that operates across multiple timeframes (Session, Weekly, Monthly, Yearly). Unlike standard profiles, this tool features a unique "Auto HVN Wall" detection system. It automatically identifies meaningful High Volume Nodes (HVNs) within the profile structure and extends them forward as potential support and resistance zones, creating a dynamic map of market structure as it develops.
Key Features
Multi-Timeframe Support: Switch seamlessly between Session, Weekly, Monthly, and Yearly profiles.
Auto HVN Walls (Structure Detection): The script analyzes the profile shape in real-time. When it detects significant clusters of volume (HVNs), it automatically draws extended lines ("walls"). These walls often act as magnets or support/resistance levels where price has previously found acceptance.
Session Filtering: When in "Session" mode, you can define specific time windows (e.g., 0930-1615) to isolate Regular Trading Hours (RTH) volume, ignoring overnight data.
Auto-Scaling Width (Monthly Mode): For Monthly profiles, the histogram width dynamically changes throughout the month. It starts wide at the beginning of the month to be visible and gradually narrows as the month progresses, keeping your chart clean.
High Precision: Uses lower timeframe data (user-selectable) to build the profile, ensuring accuracy even on higher timeframe charts.
Alerts: Built-in alert conditions for price crossing the developing POC, VAH, or VAL.
How It Works
Data Accumulation: The script fetches lower timeframe volume and price data (e.g., 5-minute data on a 1-hour chart) to construct a precise volume histogram.
Wall Detection: It runs a smoothing algorithm over the volume profile. If a price level accumulates volume significantly higher than the average (controlled by the Volume Threshold Multiplier), it marks that level as a "Wall" and extends it.
Value Area: Standard Value Area High (VAH), Value Area Low (VAL), and Point of Control (POC) are calculated and displayed for the selected period.
Settings Guide
Profile Period: Choose between Session, Weekly, Monthly, or Yearly.
Session Time: (Only active in "Session" mode) Define the start and end times for the profile (e.g., 0930-1615).
Calculation Precision: Determines the lower timeframe used to build the profile. Lower is more precise but may load slower.
The Walls:
Smoothing Factor: How much to smooth the volume data before finding walls. Higher = fewer, more significant walls.
Volume Threshold: How much volume is needed to trigger a wall.
Extend Walls: If checked, walls extend infinitely to the right.
Auto-Scale Width: (Monthly Only) dynamically adjusts the profile width based on the day of the month.
Use Case This tool is ideal for auction market theorists and volume profile traders who want to visualize where value is building in real-time and identify "sticky" price levels (Walls) where the market is likely to rotate or consolidate.
Disclaimer This script and the information presented here are for educational and informational purposes only. They do not constitute financial advice, investment recommendations, or trading signals. Trading in financial markets involves a significant risk of loss and is not suitable for all investors. Past performance of any trading system or methodology is not necessarily indicative of future results. Use this tool at your own discretion and risk.

Multi-Layer Volume Profile [BigBeluga]A powerful multi-resolution volume analysis tool that stacks multiple profiles of historical trading activity to reveal true market structure.
This indicator breaks down total and delta volume distribution across time at four adjustable depths — enabling traders to spot major POCs, volume shelves, and zones of price acceptance or rejection with unmatched clarity.
🔵 KEY FEATURES
Multi-Layer Volume Profiles:
Up to 4 separate volume profiles are stacked on the chart:
- Profile 1: Full period
- Profile 2: Half-length
- Profile 3: Quarter-length
- Profile 4: One-eighth-length
This layering helps traders assess confluence across different time horizons.
Custom Bin Resolution:
Each profile uses a customizable number of bins to control visual precision.
More bins = higher granularity, fewer bins = smoother profile.
Precise POC Highlighting:
The price level with the maximum traded volume in each profile is highlighted with a thick blue POC line.
This key level shows the most accepted price for each period.
Total and Delta Volume Labels:
- Total Volume: Displays cumulative volume over the profile period at the top of the profile box.
- Delta Volume: The difference between bullish and bearish volume is labeled at the base, showing directional pressure.
Positive delta = buyer dominance, negative delta = seller dominance.
Range Levels:
Each profile includes horizontal reference lines showing its high, low, bounds.
These edges often align with price reaction zones and become future resistance/support.
🔵 HOW IT WORKS
For each active profile, the indicator:
- Collects price range (highs/lows) across the selected `length`
- Divides this range into equal bins
- Assigns volume into bins based on candle close location
- Aggregates volume per bin to form the profile (polylines)
Separately tracks:
- Total volume (sum of all candles in range)
- Delta volume (sum of candle volumes: positive for bullish, negative for bearish closes)
Highlights the bin with maximum volume (POC)
and marks it with a thick blue line.
Adds auxiliary lines for high/low of each profile box
and total/delta volume tags with tooltips.
🔵 USAGE
Spot Acceptance Zones:
Thick, flat areas on the profile show where price stayed longest — ideal for building positions.
Identify Rejection Zones:
Thin volume areas signal price rejection and are often used for stop placement or entries.
Delta Confirmation:
Use strong positive/negative delta readings as directional bias confirmation for breakout trades.
Confluence Detection:
Watch for overlapping POCs between layers to identify extremely strong support/resistance zones.
🔵 CONCLUSION
Multi-Layer Volume Profile equips traders with a deeply layered market structure view.
Whether you're scalping intraday levels or analyzing macro support zones, the ability to stack volume perspectives, visualize directional delta, and anchor POCs provides an edge in anticipating market moves.
Use this tool to validate entries, confirm structure, and make more informed, volume-aware trading decisions.

HSI Market sessions and Volume profileHSI Market Sessions and Volume Profile
Unlock deeper market insight with this advanced volume profile indicator tailored for Hang Seng Index (HSI) and other futures instruments. This tool combines session-based volume analysis, customizable profiles, and intraday tracking for superior market structure awareness.
🔍 Key Features:
Dynamic Volume Profile: View aggregated buy/sell volume or open interest delta across customizable price zones.
POC, VAH, VAL Lines: Instantly spot the Point of Control, Value Area High, and Value Area Low for each session.
Flexible Session Options: Analyze market behavior by Tokyo, London, New York, or standard timeframes like Daily, Weekly, Monthly, Quarterly, or Yearly.
Live Zone Tracking: Stay ahead with real-time profiling of the current session.
Forex Box Option: Visualize forex trading zones even without volume profiles.
Highly Configurable: Choose from three display modes, resolution settings, and color schemes to fit your style and precision needs.
🧠 Smart Mechanics:
Adaptive to both Volume and Open Interest data.
Built-in smoothing algorithm for cleaner profiles in high-volatility assets.
Auto-reset and draw logic based on session type and bar resolution.
Intrabar data handling for more granular profiling (requires lower timeframe input).
✅ Ideal For:
HSI Futures Traders looking for market session clarity and volume zones.
Volume Profile Analysts needing flexible, session-specific profile rendering.
Day Traders and Swing Traders who value precision in trade planning.

Enhanced Volume Profile [TFO]The Enhanced Volume Profile analyzes volume by price to find potential inflection points that we can reference in future price action.
The volume profiles altogether are simply an estimation from price/volume data that TradingView is capable of providing. Below is an example of 1 day volume profiles. The left chart uses 50 rows for each profile, while the right chart uses 500 rows. As a result, the right chart is capable of providing much greater detail.
Profile Timeframe specifies the timeframe of the profile to be constructed. When set to 1 day for example, then each profile represents the price/volume data from 1 daily bar.
Resolution Timeframe is the timeframe of price/volume data used to construct the profile. Lower timeframes result in higher resolution, but also greater computation time.
Below is an example of 1 day volume profiles. Both charts are using 250 rows for every profile, but the left chart is using a 15m resolution timeframe, while the right chart is using a 1m resolution timeframe. The lower timeframe data on the right chart allows for greater detail than the left.
Volume Point of Control (VPOC) shows the price level where the most volume was traded during a given session. Show VPOCs will draw these levels on each volume profile, with the corresponding color. In the following chart, each solid blue line represents a VPOC for the corresponding session.
Extend Recent VPOCs will track the N most recent VPOC levels, and extend them to the right side of the chart for easy visual reference. Show VPOC Labels will annotate each VPOC extension with the date (and time, for lower timeframes) that each corresponding profile began. Below is an example where Extend Recent VPOCs and Show VPOC Labels are both enabled.
Show Previous HVN will show High Volume Nodes from previous sessions, and extend them until price trades through them. When a session ends, any new HVNs located above that close price will be red while any HVNs below will be green (default colors).
HVNs are validated with a strength parameter that compares the peak volume to its neighboring levels to determine local extremes, along with a percentile filter to optionally specify if valid nodes must contain a peak volume greater than X% of the volume traded at VPOC.
The same capabilities exist for Low Volume Nodes as well. Show Previous LVN will extend these Low Volume Nodes from previous sessions until price trades through them.
The default color scheme will color nodes proportionate to the individual session. For example, a HVN derived from VPOC would always result in the deepest possible color because the node's peak contains the highest volume traded for that session. Every lesser node would be colored lighter than this, proportional to that session's VPOC.
We can also choose to color these nodes in a way that reflects their relative volume compared to recent sessions. For HVNs, darker colors imply more volume was traded at said nodes while lighter colors imply less volume. In the following example, the left chart uses the session based color scheme while the right chart uses the historical color scheme.

Oscillator Volume Profile [Trendoscope®]The Oscillator Volume Profile indicator is designed to construct a volume profile based on predefined oscillator levels. It integrates volume data with oscillator readings to offer a unique perspective on market dynamics.
🎲 Selectable Oscillators:
Users can select from an array of oscillator options for the basis of the volume profile, including:
Relative Strength Index (RSI)
Chande Momentum Oscillator (CMO)
Center of Gravity (COG)
Money Flow Index (MFI)
Rate of Change (ROC)
Commodity Channel Index (CCI)
Stochastic Oscillator (Stoch)
True Strength Index (TSI)
Williams %R (WPR)
The length parameters - Length, Fast Length, Slow Length allows users to define the period over which the chosen oscillator is calculated, tailoring the sensitivity of the indicator to their trading strategy.
🎲 Dynamic Overbought/Oversold Ranges:
This indicator enhances traditional concepts by introducing dynamic overbought and oversold levels. These adaptable thresholds are calculated using various methods, including:
🎯 Highest/Lowest Range Method : This method establishes the range based on the highest and lowest values of the oscillator within the last N bars.
🎯 Moving Average Range Method : The range is derived from a moving average of the oscillator, providing a smoothed threshold that reflects more recent market conditions.
In addition to these methods, the indicator incorporates a unique 'Sticky Border' feature:
🎯 Sticky Border: With this option enabled, the dynamic ranges maintain their levels until the oscillator breaks out of the range. Once a breakout occurs, the levels are recalculated and updated. This mechanism ensures that the borders remain consistent and relevant, only adjusting to significant market movements that warrant a recalculation.
Users can select their preferred method for determining dynamic ranges, allowing for a customized approach that aligns with their analysis and trading strategy. The sticky border feature further refines this functionality, offering continuity until a decisive market move occurs.
🎲 Volume Profile Calculation Parameters:
🎯 Trend Filter: The indicator provides a versatile trend filter with four selectable options:
Uptrend: The volume profile is calculated when the oscillator indicates an uptrend.
Downtrend: The volume profile is calculated when the oscillator indicates a downtrend.
Any: The volume profile is calculated regardless of the trend.
External: Users can input values from an external indicator. The volume profile is then calculated only when the external indicator's value is non-zero, integrating external analysis into the volume profile construction.
🎯 Precision: Users have the option to define the precision for calculating the volume profile, which is crucial due to the varying scales of different oscillators (e.g., some oscillators range from 0 to 100, while others from -1 to 1). Selecting an appropriate precision ensures that the volume profile is accurately aligned with the minimal price range significant to the chosen oscillator. This setting requires user intervention for optimal configuration, as automatic calculation is not feasible due to the diverse nature of oscillator ranges.
🎯 Number of Bars: Users can select a specific number of bars for volume profile calculation, or opt to include all available historical bars for a comprehensive profile.
🎲 Selecting the right precision:
Users must select the right precision based on their choice of indicator. For example, RSI values range from 0-100. Hence, the default precision of 1 work fine on RSI as the volume profiles are plotted from 0 to 100 at the interval of 0.1
But, the default precision of 1 will not be ok on TSI because TSI values range from -1 to 1. Hence, using 1 as precision will result in very less volume profile lines as shown below.
Due to this, it is necessary to increase the precision for oscillators such as TSI where the range between highest and lowest value is far less. Once we set the precision to 2, we can see more appropriate volume profile division.
🎲 Note of thanks:
This publication uses polyline feature for drawing volume profiles. The advantage of using polyline is that we can overcome max 500 lines issue that we face by using the regular line objects. More details of polyline can be found in the tradingview blog post
Further, using polyline for display of volume profiles is inspired by the publications of fikira and KioseffTrading

MFI Volume Profile [Kodexius]The MFI Volume Profile indicator blends a classic volume profile with the Money Flow Index so you can see not only where volume traded, but also how strong the buying or selling pressure was at those prices. Instead of showing a simple horizontal histogram of volume, this tool adds a money flow dimension and turns the profile into a price volume momentum heat map.
The script scans a user controlled lookback window and builds a set of price levels between the lowest and highest price in that period. For every bar inside that window, its volume is distributed across the price levels that the bar actually touched, and that volume is combined with the bar’s MFI value. This creates a volume weighted average MFI for each price level, so every row of the profile knows both how much volume traded there and what the typical money flow condition was when that volume appeared.
On the chart, the indicator plots a stack of horizontal boxes to the right of current price. The length of each box represents the relative amount of volume at that price, while the color represents the average MFI there. Levels with stronger positive money flow will lean toward warmer shades, and levels with weaker or negative money flow will lean toward cooler or more neutral shades inside the configured MFI band. Each row is also labeled in the format Volume , so you can instantly read the exact volume and money flow value at that level instead of guessing.
This gives you a detailed map of where the market really cared about price, and whether that interest came with strong inflow or outflow. It can help you spot areas of accumulation, distribution, absorption, or exhaustion, and it does so in a compact visual that sits next to price without cluttering the candles themselves.
Features
Combined volume profile and MFI weighting
The indicator builds a volume profile over a user selected lookback and enriches each price row with a volume weighted average MFI. This lets you study both participation and money flow at the same price level.
Volume distributed across the bar price range
For every bar in the window, volume is not assigned to a single price. Instead, it is proportionally distributed across all price rows between the bar low and bar high. This creates a smoother and more realistic profile of where trading actually happened.
MFI based color gradient between 30 and 70
Each price row is colored according to its average MFI. The gradient is anchored between MFI values of 30 and 70, which covers typical oversold, neutral and overbought zones. This makes strong demand or distribution areas easier to spot visually.
Configurable structure resolution and depth
Main user inputs are the lookback length, the number of rows, the width of the profile in bars, and the label text size. You can quickly switch between coarse profiles for a big picture and higher resolution profiles for detailed structure.
Numeric labels with volume and MFI per row
Every box is labeled with the total volume at that level and the average MFI for that level, in the format Volume . This gives you exact values while still keeping the visual profile clean and compact.
Calculations
Money Flow Index calculation
currentMfi is calculated once using ta.mfi(hlc3, mfiLen) as usual,
Creation of the profileBins array
The script creates an array named profileBins that will hold one VPBin element per price row.
Each VPBin contains
volume which is the total volume accumulated at that price row
mfiProduct which is the sum of volume multiplied by MFI for that row
The loop;
for i = 0 to rowCount - 1 by 1
array.push(profileBins, VPBin.new(0.0, 0.0))
pre allocates a clean structure with zero values for all rows.
Finding highest and lowest price across the lookback
The script starts from the current bar high and low, then walks backward through the lookback window
for i = 0 to lookback - 1 by 1
highestPrice := math.max(highestPrice, high )
lowestPrice := math.min(lowestPrice, low )
After this loop, highestPrice and lowestPrice define the full price range covered by the chosen lookback.
Price range and step size for rows
The code computes
float rangePrice = highestPrice - lowestPrice
rangePrice := rangePrice == 0 ? syminfo.mintick : rangePrice
float step = rangePrice / rowCount
rangePrice is the total height of the profile in price terms. If the range is zero, the script replaces it with the minimum tick size for the symbol. Then step is the price height of each row. This step size is used to map any price into a row index.
Processing each bar in the lookback
For every bar index i inside the lookback, the script checks that currentMfi is not missing. If it is valid, it reads the bar high, low, volume and MFI
float barTop = high
float barBottom = low
float barVol = volume
float barMfi = currentMfi
Mapping bar prices to bin indices
The bar high and low are converted into row indices using the known lowestPrice and step
int indexTop = math.floor((barTop - lowestPrice) / step)
int indexBottom = math.floor((barBottom - lowestPrice) / step)
Then the indices are clamped into valid bounds so they stay between zero and rowCount - 1. This ensures that every bar contributes only inside the profile range
Splitting bar volume across all covered bins
Once the top and bottom indices are known, the script calculates how many rows the bar spans
int coveredBins = indexTop - indexBottom + 1
float volPerBin = barVol / coveredBins
float mfiPerBin = volPerBin * barMfi
Here the total bar volume is divided equally across all rows that the bar touches. For each of those rows, the same fraction of volume and volume times MFI is used.
Accumulating into each VPBin
Finally, a nested loop iterates from indexBottom to indexTop and updates the corresponding VPBin
for k = indexBottom to indexTop by 1
VPBin binData = array.get(profileBins, k)
binData.volume := binData.volume + volPerBin
binData.mfiProduct := binData.mfiProduct + mfiPerBin
Over all bars in the lookback window, each row builds up
total volume at that price range
total volume times MFI at that price range
Later, during the drawing stage, the script computes
avgMfi = bin.mfiProduct / bin.volume
for each row. This is the volume weighted average MFI used both for coloring the box and for the numeric MFI value shown in the label Volume .

Delta Volume Profile [BigBeluga]🔵Delta Volume Profile
A dynamic volume analysis tool that builds two separate horizontal profiles: one for bullish candles and one for bearish candles. This indicator helps traders identify the true balance of buying vs. selling volume across price levels, highlighting points of control (POCs), delta dominance, and hidden volume clusters with remarkable precision.
🔵 KEY FEATURES
Split Volume Profiles (Bull vs. Bear):
The indicator separates volume based on candle direction:
If close > open , the candle’s volume is added to the bullish profile (positive volume).
If close < open , it contributes to the bearish profile (negative volume).
ATR-Based Binning:
The price range over the selected lookback is split into bins using ATR(200) as the bin height.
Each bin accumulates both bull and bear volumes to form the dual-sided profile.
Bull and Bear Volume Bars:
Bullish volumes are shown as right-facing bars on the right side, colored with a bullish gradient.
Bearish volumes appear as left-facing bars on the left side, shaded with a bearish gradient.
Each bar includes a volume label (e.g., +12.45K or -9.33K) to show exact volume at that price level.
Points of Control (POC) Highlighting:
The bin with the highest bullish volume is marked with a border in POC+ color (default: blue).
The bin with the highest bearish volume is marked with a POC− color (default: orange).
Total Volume Density Map:
A neutral gray background box is plotted behind candles showing the total volume (bull + bear) per bin.
This reveals high-interest price zones regardless of direction.
Delta and Total Volume Summary:
A Delta label appears at the top, showing net % difference between bull and bear volume.
A Total label at the bottom shows total accumulated volume across all bins.
🔵 HOW IT WORKS
The indicator captures all candles within the lookback period .
It calculates the price range and splits it into bins using ATR for adaptive resolution.
For each candle:
If price intersects a bin and close > open , volume is added to the positive profile .
If close < open , volume is added to the negative profile .
The result is two side-by-side histograms at each price level—one for buyers, one for sellers.
The bin with the highest value on each side is visually emphasized using POC highlight colors.
At the end, the script calculates:
Delta: Total % difference between bull and bear volumes.
Total: Sum of all volumes in the lookback window.
🔵 USAGE
Volume Imbalance Zones: Identify price levels where buyers or sellers were clearly dominant.
Fade or Follow Volume Clusters: Use POC+ or POC− levels for reaction trades or breakouts.
Delta Strength Filtering: Strong delta values (> ±20%) suggest momentum or exhaustion setups.
Volume-Based Anchoring: Use profile levels to mark hidden support/resistance and execution zones.
🔵 CONCLUSION
Delta Volume Profile offers a unique advantage in market reading by separating buyer and seller activity into two visual layers. This allows traders to not only spot where volume was high, but also who was more aggressive. Whether you’re analyzing trend continuations, reversals, or absorption levels, this indicator gives you the transparency needed to trade with confidence.
